Do you want to run A/B split tests on your WordPress site to improve conversions? Split testing helps you understand how small changes in content and design affect user behavior. In this article, we will show you how to easily do A/B split testing in WordPress using Google Optimize.
What is A/B Split Testing?
A/B split testing is a technique that allows you to compare two versions of the same web page against each other, so you can determine which one performs better and produces better results.
Marketers use A/B split testing for their landing pages to find out which one gets them more conversions and sales.
Split testing can be used to test any element on the page including call-to-action buttons, color schemes, layout changes, marketing text, images, and more.
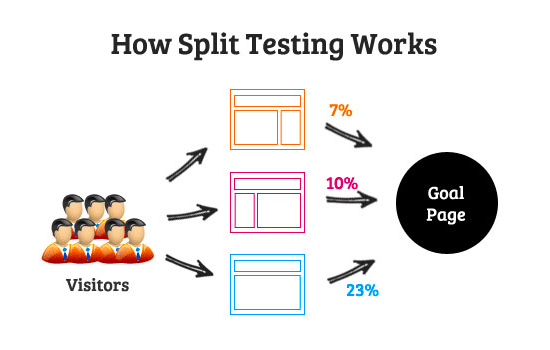
How A/B Split Testing Works?
Basically, you show different variations of a page to your audience. After that, you track user engagement and conversions to find out which variation gives you the best results.
Preparing for A/B Split Testing
Before we move forward, there are a few things you would need for this tutorial.
First, you will need MonsterInsights plugin. For more details, see our step by step guide on how to install a WordPress plugin.
MonsterInsights is the best Google Analytics plugin for WordPress. You’ll need at least their Pro plan in order to access Google Optimize addon which we will be using in this tutorial.
If you haven’t already done so, then you need to sign up and install Google Analytics in WordPress.
Lastly, you will need Google Optimize. It is a free tool that allows you to run split testing experiments on your website. We will show you how to set it up in the next step.
Ready? Let’s get started.
Setting up Google Optimize in WordPress
First, you need to visit the Google Optimize website to create your account.
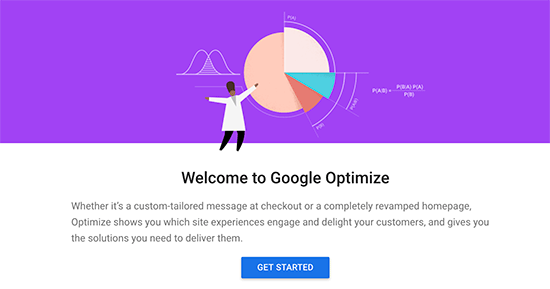
Follow the on-screen instructions, and you will reach your account dashboard. Google Optimize will automatically create an Account and a Container for you.
Next, you need to connect your Google Optimize account to the Google Analytics property of your website. To do that, click on ‘Link to Google Analytics’ tab from the right-hand column.
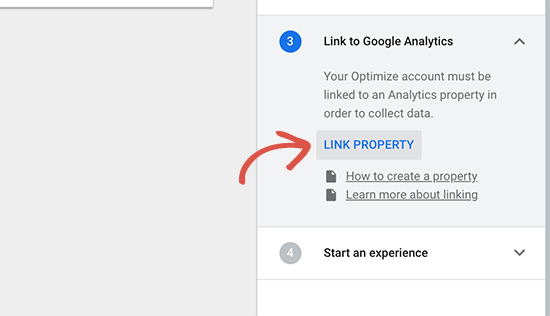
Clicking on the button will show all Google Analytics properties available under your Google account. You need to select the one associated with your website.
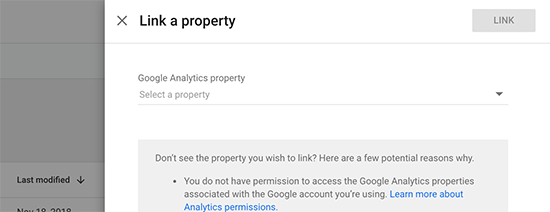
Next, click on the Link button to continue.
Google Optimize will now connect to your Google Analytics property. This will allow Google Optimize to share data with Google Analytics which you can then view in your reports.
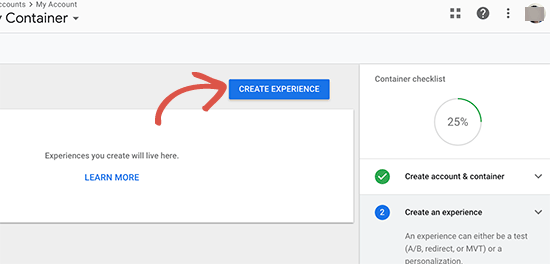
Now, it is time to create your first experience. Click on the ‘Create Experience’ button to continue.
You will now be asked to provide a name for your experience and enter the URL of the page where this experience will run.
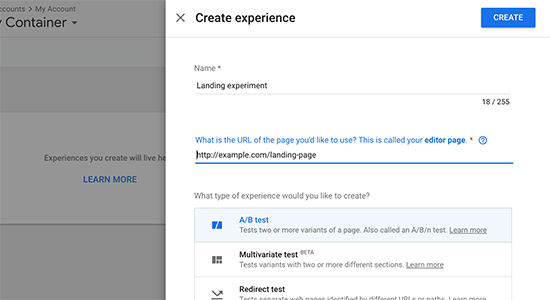
You will also be asked to choose a type for your experience. You need to select A/B test and then click on the ‘Create’ button to continue.
Optimize will now create your experience, and you will be redirected to the experience page. It will automatically show the original page as your first variation.
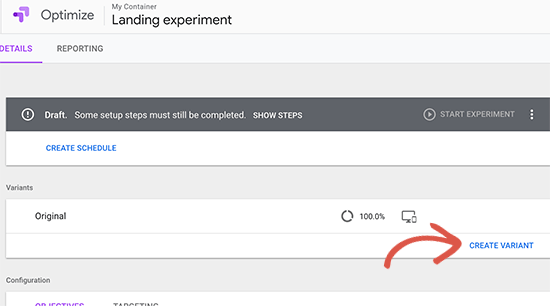
You need to click on the add variation button to create a new version. Optimize will ask you to provide a name for this variation. It is a good practice to use a name that reflects the changes you are going to apply in this variation.
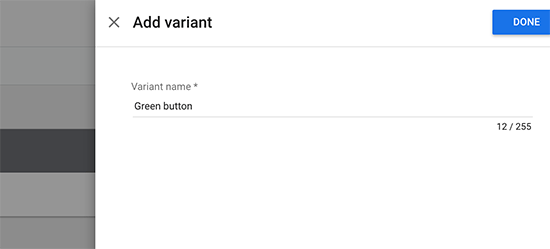
Click on the Done button to continue.
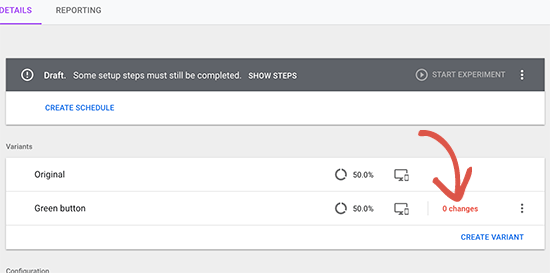
Optimize will now list your new variation on the experience page. Click on the ‘0 changes’ link next to your new variation to edit it.
Google Optimize will now open the page where you want to run the test with a powerful editor. It is a simple drag and drop tool that you can use to make changes to your page.
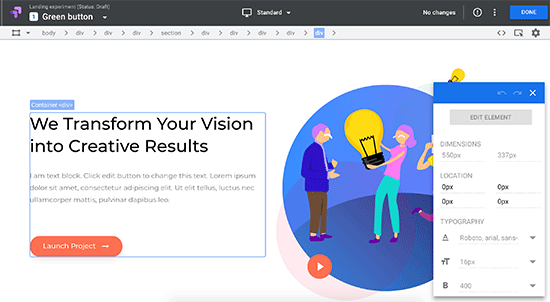
You can just point and click on any element in your page to make changes. For the purpose of this tutorial, we are going to change the color of our main call to action button.
After you have made the changes that you want to test, you need to click on the ‘Done’ button to exit the editor.
You will now see your new variation listed with the number of changes you made to it.
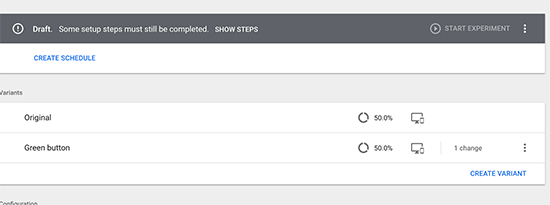
You can continue editing or add another variant to your experience.
After that, you need to select an objective for your experience. Just below the variants you will see the option to select experience objective.
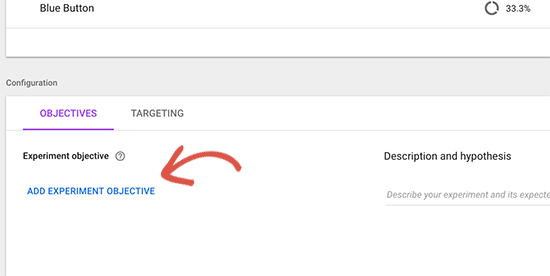
Clicking on it will open views from your Google Analytics reports.
If you are already using goals and events, or eCommerce tracking, then you will see them listed there.
After selecting objective, you can enter a hypothesis about what you are testing and what you are expecting from this experiment.
Your experience is almost ready but first, you need to connect Google Optimize with MonsterInsights.
Connecting Google Optimize to MonsterInsights
MonsterInsights helps you easily connect your WordPress site to Google Optimize.
First, you need to visit Insights » Addons page in your WordPress admin area. From here, you need to install and activate the ‘Google Optimize’ addon.
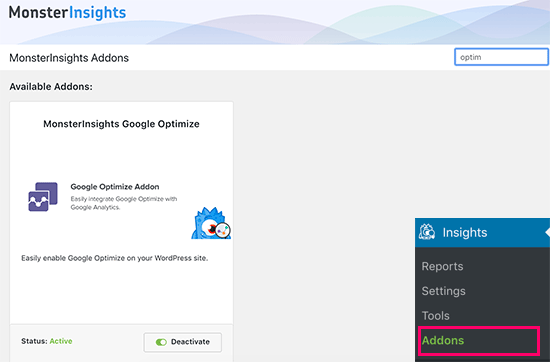
Upon activation, you need to visit Insights » Settings page and switch to the tracking tab. From here you need to scroll down and click on the Google Optimize tab.
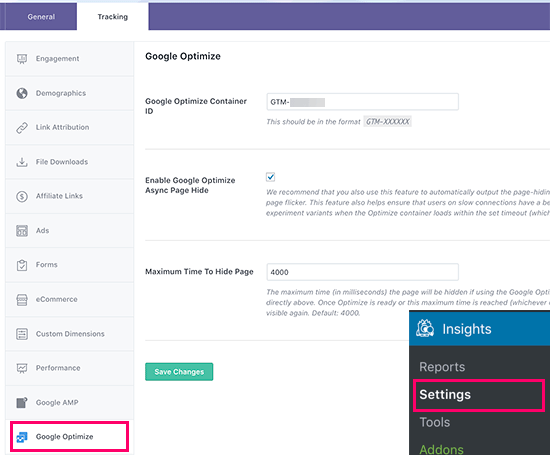
Now you need to provide your Google Optimize container ID. You can find this information under your Google Optimize account by clicking on the ‘Container Setup’ tab in the right column.
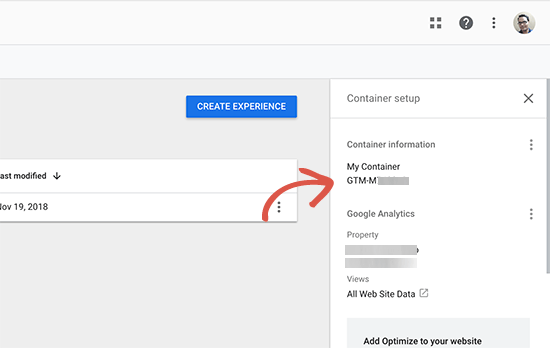
Copy and paste your container ID in MonsterInsights’ Google Optimize settings page and then click on the ‘Save changes’ button to store your settings.
That’s all you have successfully installed Google Optimize on your website and you are now ready to run your experiments.
Scheduling and Running Your A/B Split Test
Now that everything is in order, you are ready to schedule and run your A/B split test.
Switch to Google Optimize dashboard and open your experience. From here you can just go ahead and click on the ‘Run Experiment’ button to manually launch it.
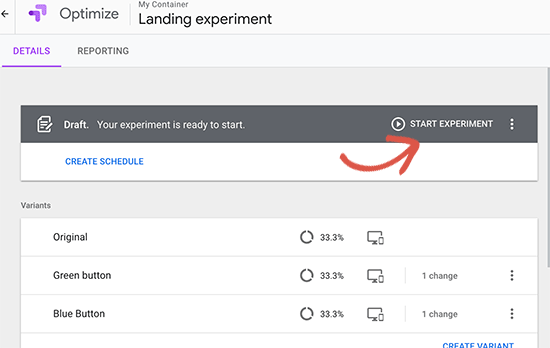
You can also click on the ‘Create Schedule’ button to set up a schedule for your experiment. Make sure you provide enough time for the experiment to collect visits and data.
Viewing Your A/B Split Testing Reports in Google Optimize
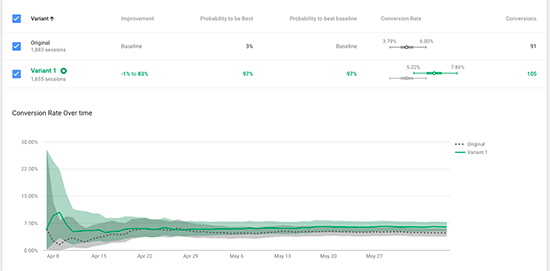
Google Optimize will now show different variations of your page to users and start collecting data. After it has collected enough data, you can view the results under the reporting tab.
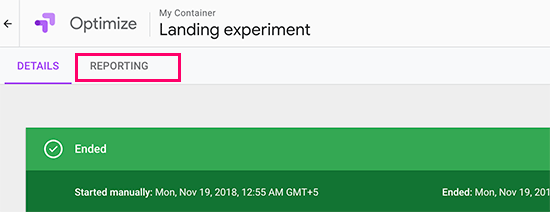
It will show how each variant performed based on the experiment objective (Google Analytics goals, event, or views you selected).
